Quick Answer
Viral Intelligence is the outside evidence that opens a closed loop: everything else generates from your own brand description, which can only produce plausible content, never validated content. It counts real posts from accounts you track, refreshes the whole competitor set for a flat 5 credits (or one account for 1), runs a market scan for 8, and breaks a single video down into hook, shots, camera moves and on-screen text for 5. Nothing is modelled, estimated or smoothed — where there are three posts it says three.
Generating from your own brand description is a closed loop. What competitor signals, market scans and per-video breakdowns actually measure, and what they cannot.
Keep reading
Related next steps
Every generator has the same structural flaw, and it is rarely named. You describe your brand. The tool generates from that description. What comes back is, by construction, *plausible* — consistent with what you said about yourself.
Plausible is not the same as validated. A closed loop cannot tell you that your category has moved, that the format you are copying stopped working in March, or that the thing your audience actually watches is nothing like your brief.
Viral Intelligence is the outside evidence: real posts, real numbers, from the accounts you actually compete with.
Every number is counted, not estimated
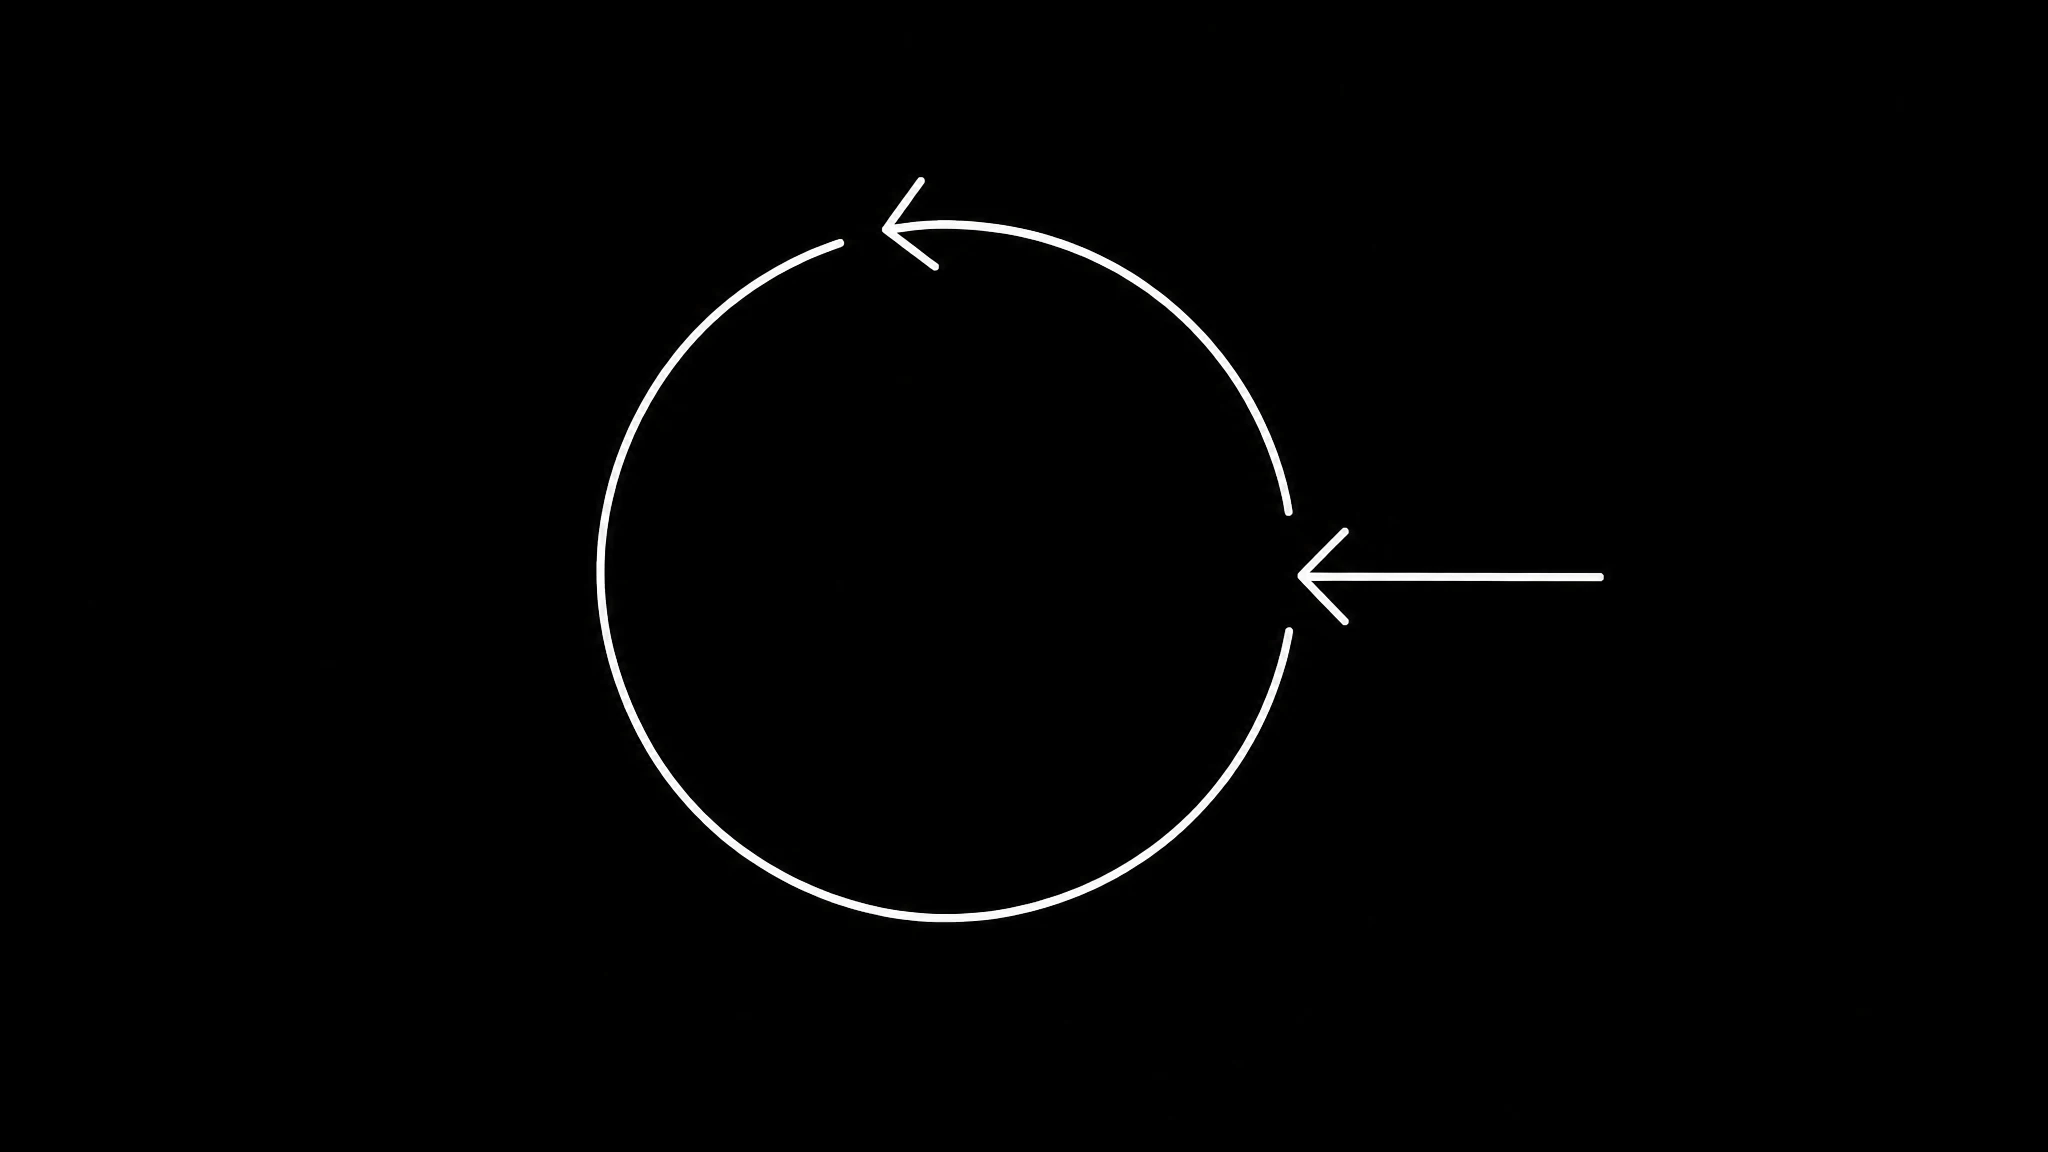
The rule the surface is built on: nothing is modelled, estimated or smoothed. Where we hold three posts, it says three.
That sounds like a small thing and it is the whole credibility of the feature. A confident-looking trend line drawn through four data points is worse than an empty state, because an empty state tells you to go and get more data while a smoothed curve tells you a story. It is the same failure the statistics literature calls overfitting ↗, dressed up as a dashboard. Most competitive-intelligence dashboards choose the curve. This one does not, which means it will sometimes show you a sparse, unimpressive wall — and that wall is honest.
What it costs to look
| action | credits |
|---|---|
| brand DNA analysis | 10 (the first one on an account is free) |
| market scan | 8 |
| add the ad-library leg | 12 |
| refresh the whole competitor set | 5 |
| refresh one account | 1 |
| pull one video ad's transcript | 3 |
| break one video down | 5 |
Two of those numbers have stories worth telling, because both were wrong before they were right.
The market scan used to cost 25 credits, priced before anyone measured it. When two real scans were measured, most of the upstream cost turned out to be the ad-library legs, which cost five times what an organic search call does. Those legs became opt-in, the default scan got much cheaper to run, and the price came down to 8 — chosen so it fits inside the credits a free account starts with. The market read is the thing that shows what the product is for, so it must not sit behind the paywall it is supposed to motivate.
Refreshing one account used to cost 5, the same as refreshing the entire set. That is the full price for a twelfth of the work, which is exactly why re-pulling the one handle you care about felt expensive: it was. It is 1 now.
We are printing both because a price that changed is more informative than a price that never did. The current meter is on the pricing page.
Organic signals rank. Ad signals do not.
This is the most useful distinction on the surface, and it is easy to get wrong.
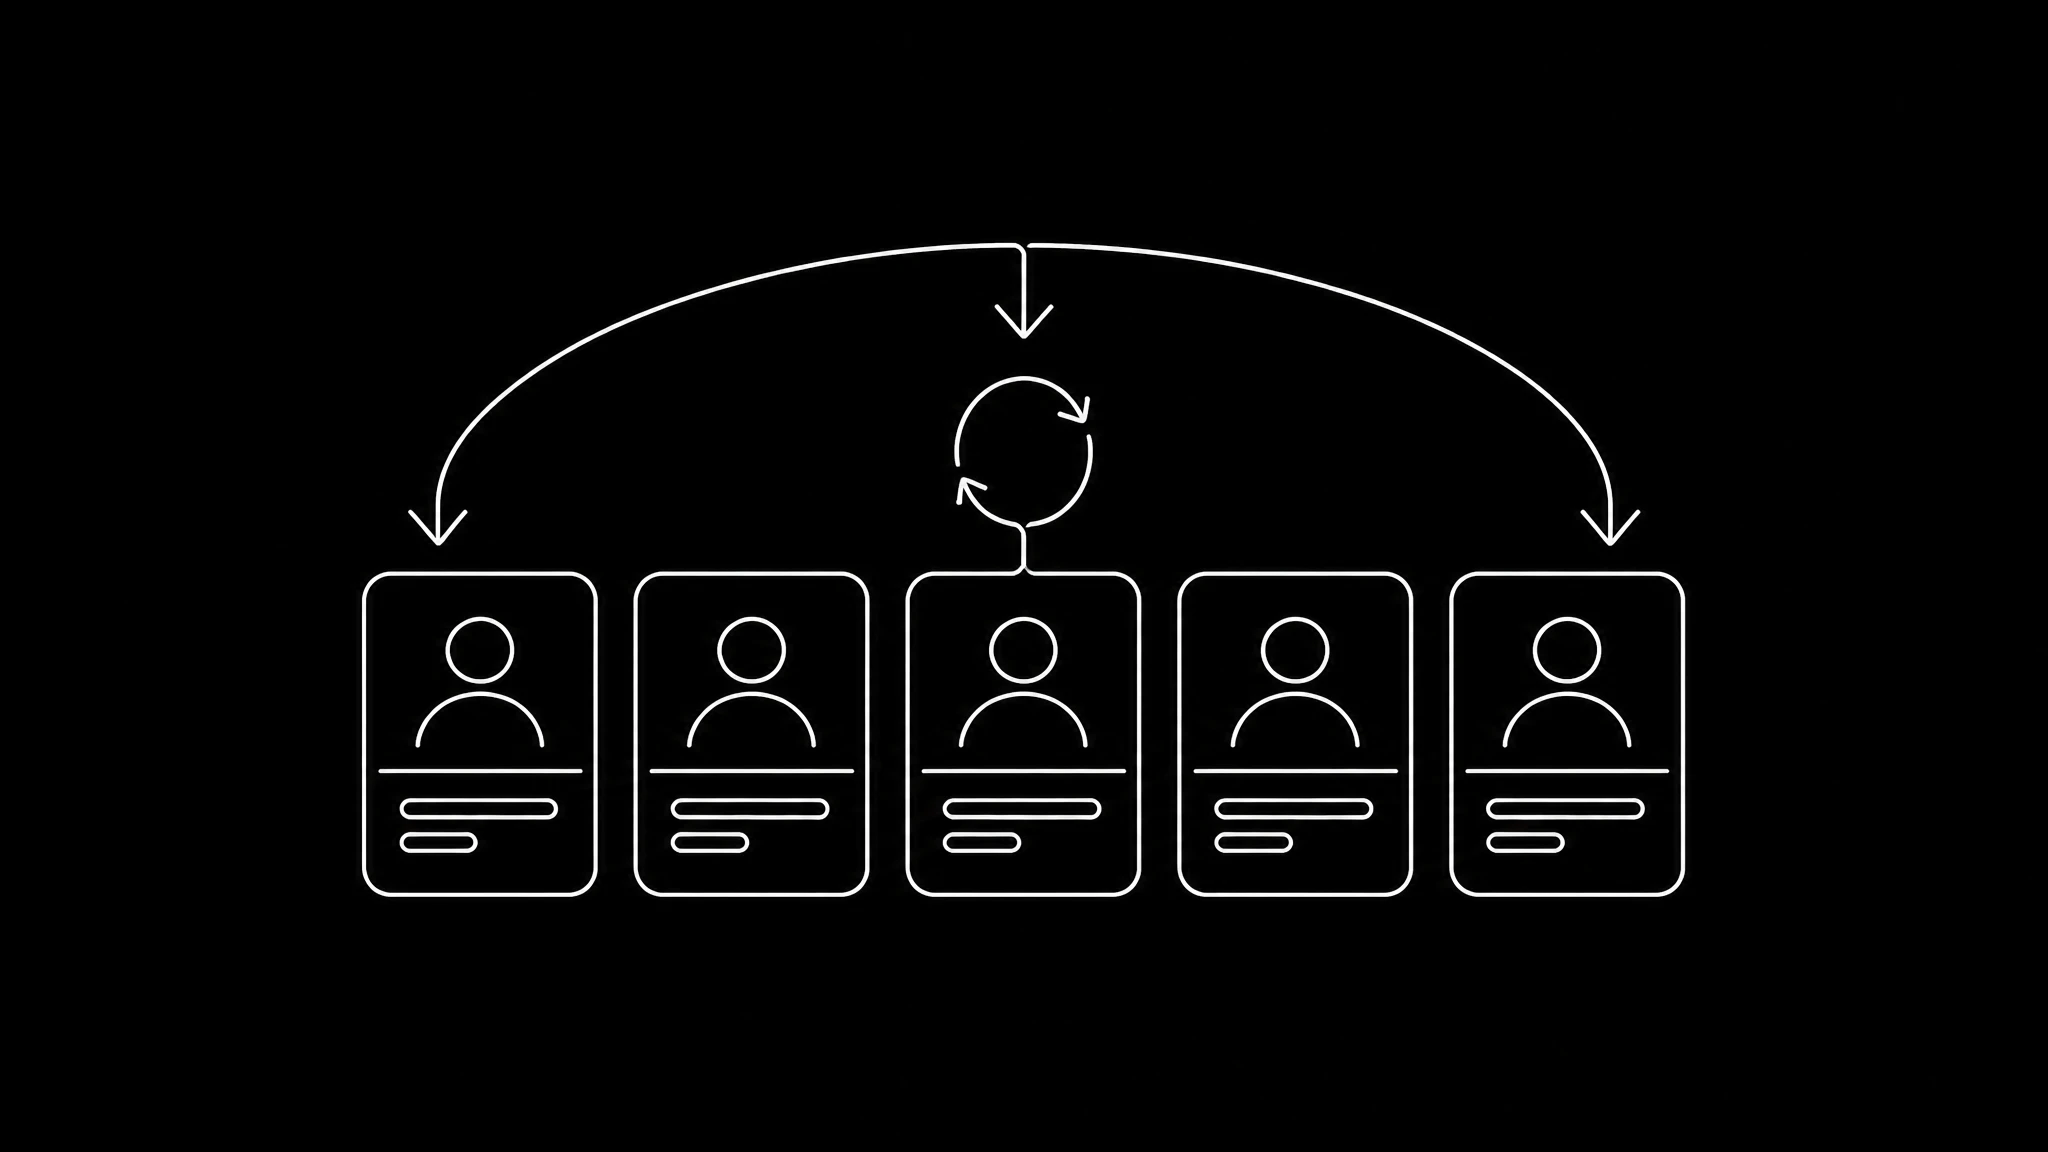
Organic posts carry view counts. They can be ranked, compared against an account's own baseline, and used to answer "what is working right now." Free tools like the TikTok Creative Center ↗ show the same class of signal at category level rather than for the specific accounts you compete with.
The Meta Ad Library ↗ returns no view counts. Its creative cannot be ranked, cannot carry a performance multiplier and cannot answer that question. It tells you what a competitor is *paying* to run and how long they have run it. A long-lived ad is probably a working ad, which is a real but weaker signal.
So: use organic data to decide what to make, and ad data to see what claims and creative your category is buying. Mixing them produces a leaderboard where half the rows have no score. The ad-side workflow goes into what to do with the creative once you have it.
Breaking down a single video
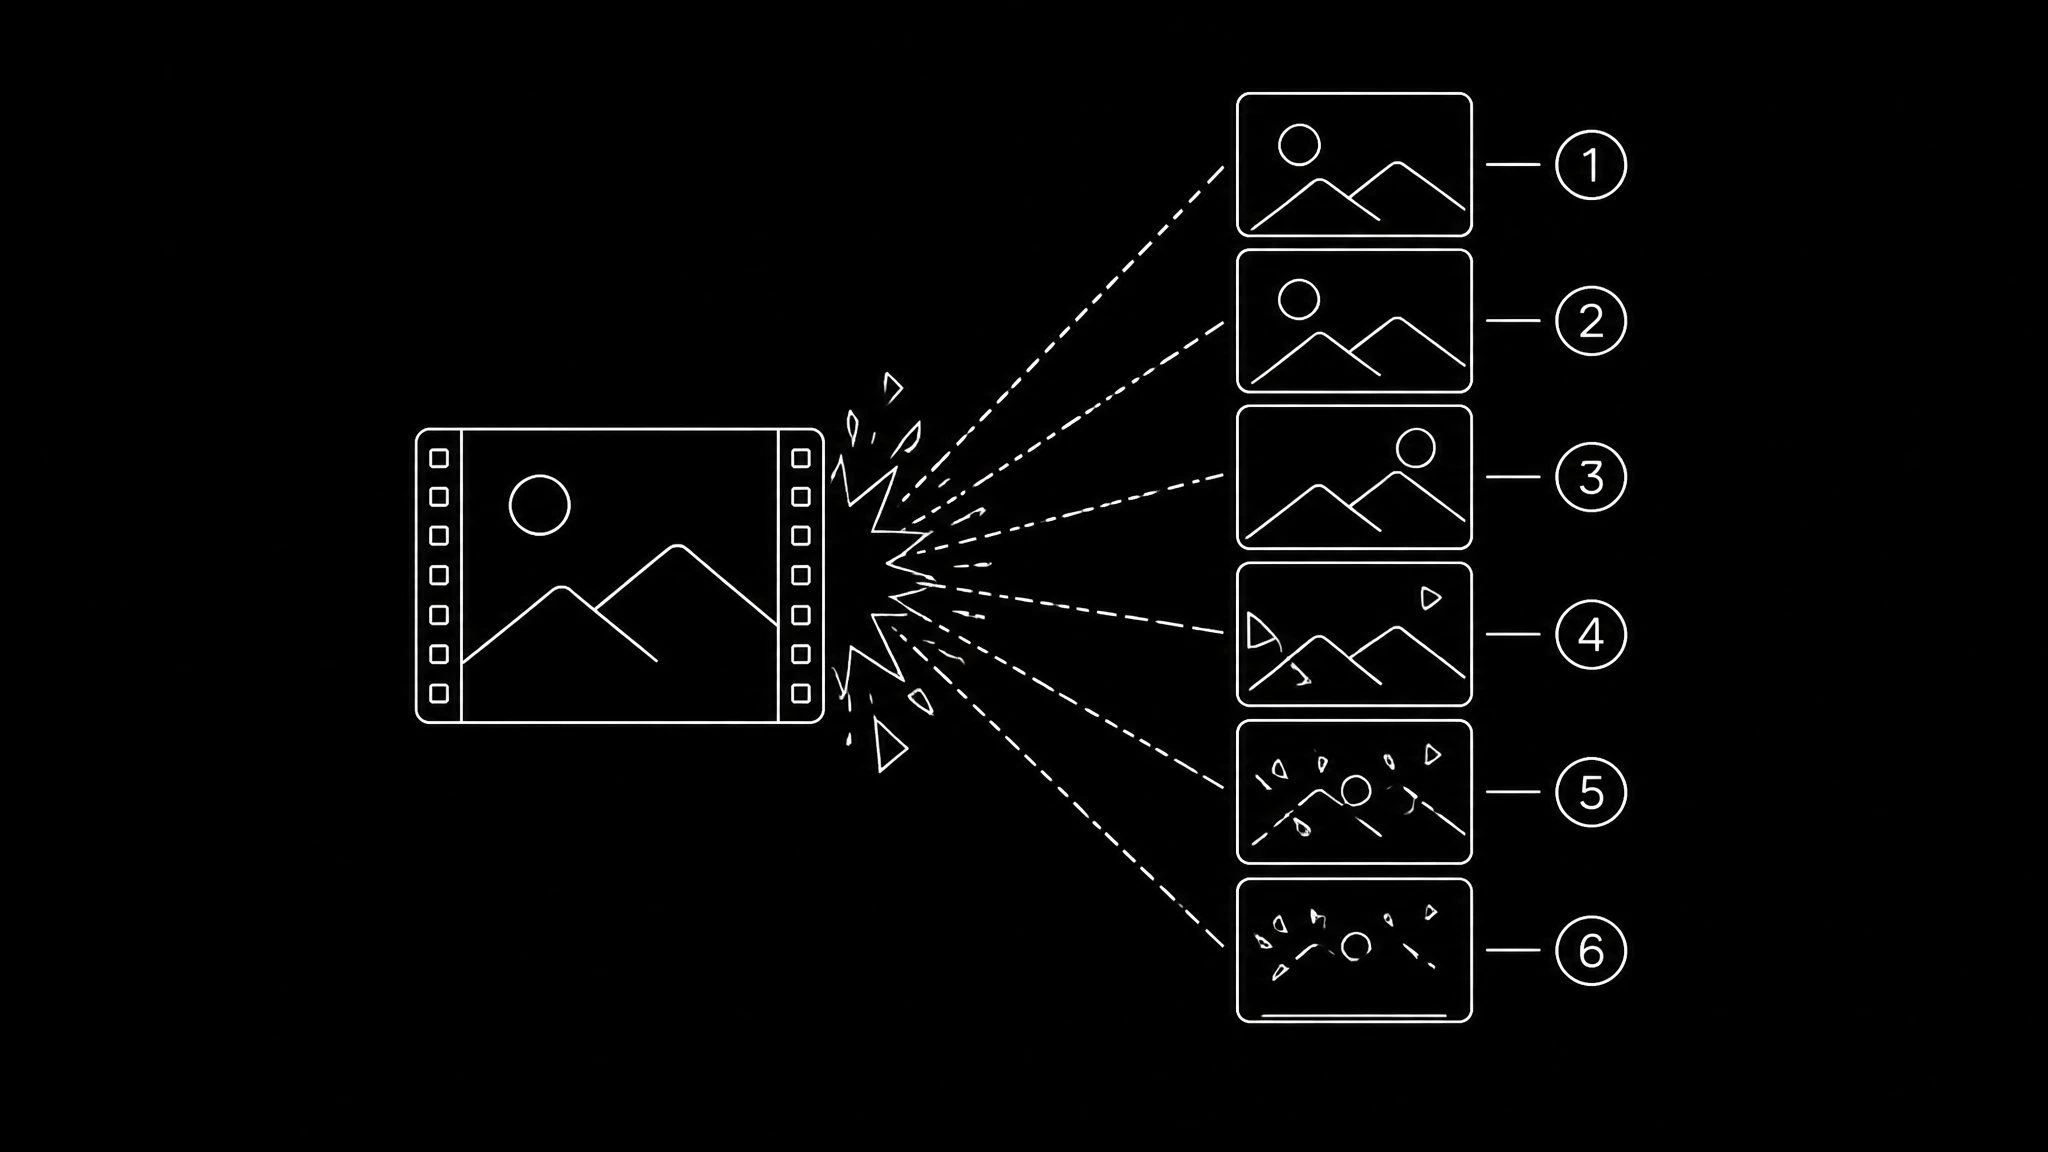
Separately from the competitor wall, you can paste one video link and get it taken apart for 5 credits:
- The hook, and a reading of why it works.
- Every scene, with shot type, camera movement, a description and the on-screen text.
- First and last frames per scene.
- Style: the visual treatment, the colour, the editing rhythm, the vibe.
- The transcript, timed.
This is the bridge between noticing something worked and being able to do it. "Great hook" is not actionable; "static medium close-up, on-screen text appears at 0.4s, first cut at 1.9s" is.
It is also the input to Content Replication, which takes the same reading and rebuilds the structure with your avatar and your words rather than leaving you to reproduce it by hand.
How to actually use it
- Track the accounts you genuinely compete with, not the biggest ones in your category. A creator with 40,000 followers in your niche is more informative than a brand with four million.
- Refresh the set weekly, not daily. At 5 credits for the whole roster, cost is not the constraint — noise is. Week-over-week movement is a signal; day-over-day is mostly randomness.
- Rank organically, then look at ads separately. Never in one list.
- Break down the top two or three posts, not the top twenty. The point is to find a structure you can perform, and you can only perform one at a time.
- Then go and make it. A dashboard that never turns into a video is a hobby.
If you would rather start from your own material, brand DNA analysis reads your site and extracts the identity — free the first time on an account. If you want to skip straight to performing a format you already found, go to Content Replication or render a straight talking-head clip. Third-party tools such as Similarweb ↗ answer the traffic version of this question; this one is specifically about what short video is earning attention. The explore page is real output, and the model catalogue lists what renders it.
Related on Percify
- Content Replication — perform what you found.
- Shot-for-shot remakes — the walkthrough version.
- Making a UGC video ad — turn a signal into an ad.
- Avatar Studio — render the clip.
- Podcast Studio — two voices, one video.
- Build your digital twin — make it your face.
- Every studio at a glance — the whole product on one page.
- What it costs — one credit meter.
- Real output — finished work rather than a showreel.
Ready to Create Your Own AI Avatar?
Make a talking video of yourself from one photo, in your own voice. No watermark on any plan.
Cancel anytime from your profile
Got questions?
Frequently asked
Because most of them generate from your own brand description, which is a closed loop. It can only produce content consistent with what you said about yourself; it cannot tell you the category has moved or that the format stopped working. Outside evidence — real posts with real view counts from accounts you compete with — is what opens it.
5 credits to refresh the entire tracked set, or 1 credit for a single account. A market scan is 8 credits, the optional ad-library leg is 12, a video ad transcript is 3, and breaking down one video is 5. The first brand DNA analysis on an account is free.
No. The Facebook Ad Library returns no view counts, so ad creative cannot be ranked or given a performance multiplier. It shows what a competitor pays to run and how long it has run. Organic posts carry real view counts and are the correct source for ranking.
The hook and a reading of why it works, every scene with its shot type, camera movement, description and on-screen text, first and last frames, a style read covering visual treatment, colour, editing and vibe, and a timed transcript. It costs 5 credits and feeds straight into replicating the format.
Weekly. At 5 credits for a whole roster the cost is not the constraint — noise is. Week-over-week movement is a signal; day-over-day movement is mostly randomness.